By Simit Patel, Ph.D., Field Application Scientist
When asked what the best single cell quality control thresholds are, I know the person asking wants a number such as:
- Cells with a total count between X and Y are of good quality.
- You need at least X number of detected genes for a cell to be informative.
- Cells with more than X% of mitochondrial counts are of bad quality.
The real answer is it depends.
Why there is no one best single cell quality control threshold
When I started analyzing single cell RNA-Seq data, I found myself asking the same questions. At first, I was expecting some standards to emerge in the field as they did for interpreting PHRED base call quality scores in NGS sequencing data. Instead of standard threshold values, the field developed a broad set of considerations to account for when assessing single cell quality.
To date, the best set of single cell quality control threshold recommendations I have seen are outlined in Luecken & Theis (2019). This paper is a personal favorite of mine to which I refer often.
From my own hands-on experience, here are the most important lessons I have learned when deciding which single cell QA/QC thresholds to use.
Reason one: single cell threshold selection is a trade-off between quality and quantity
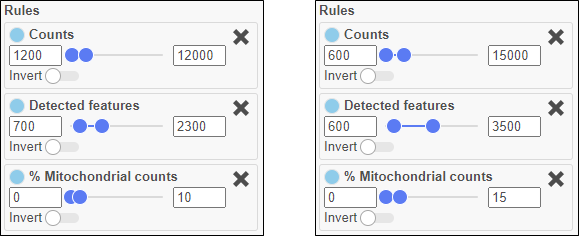
If you are more stringent with your thresholds, you will retain fewer cells of higher quality. If you are more lenient, you will retain more cells, some of which may be of lower quality.

Figure 1. Narrow, stringent thresholds on the left. Wider, more lenient thresholds on the right. The lenient settings will retain more single cells, but some of them might be less informative, more likely to be doublets, and more damaged.
How stringent or lenient you are will depend on how many cells you need to answer your research question, and at what quality.
Do you need many cells to assess the general heterogeneity of a sample? If so, perhaps you can afford to be more lenient.
Are you looking for a rare cell type that may be present in low frequency? Go lenient.
Do you need highly accurate cell type identifications for a set of cells? If so, perhaps it makes sense to be more stringent.
Reason two: metrics in the biological sample context matters in threshold selection
The biology of the sample or an experimental treatment may affect the single cell quality control metrics in a predictable way.
For example, you might be tempted to set the maximum percentage of mitochondrial counts threshold to 15%, because a higher percentage is typically indicative of a damaged cell. However, if you are working with a more metabolically active tissue, such as the kidney, a maximum threshold of ~30% makes more biological sense (Liao et al. 2020).
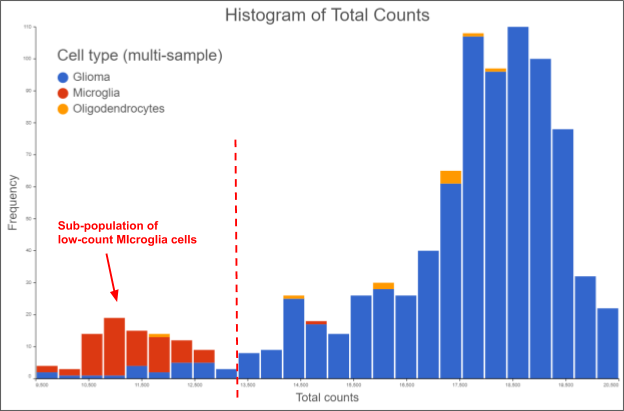
Perhaps you are working with a dissociated tumor sample and expecting some infiltrating normal cells, which are known to be smaller than the tumor cells. It stands to reason those smaller cells will have less total RNA content, so we would expect their total count to be lower. In this case, it might make sense to lower the minimum total count threshold, so you don’t inadvertently exclude a sub-population of infiltrating normal cells.

Figure 2. Frequency distribution of total counts from a dissociated glioma sample. The data is from the MGH56 sample taken from (Venteicher et al. 2017), processed and visualized in Partek Flow v9. Setting the minimum total count threshold where the broken red line is will inadvertently exclude the infiltrating microglial sub-population
These are just a couple of examples of things to consider when selecting a single cell QA/QC threshold. Other things to consider are the expected effects of treatments, gene knockouts, and sample handling on the three quality metrics.
Conclusion
Don’t be afraid of making a mistake. You will not break the data by choosing different thresholds. The original data will always be intact, so you can go back and re-run things.
So, make a choice. It doesn’t have to be a perfect choice, just make a choice, and test it. Look at the downstream clustering, biomarkers, differential gene expression results, and visualizations

