The Most Powerful & Intuitive Single Cell Analysis Solution Available
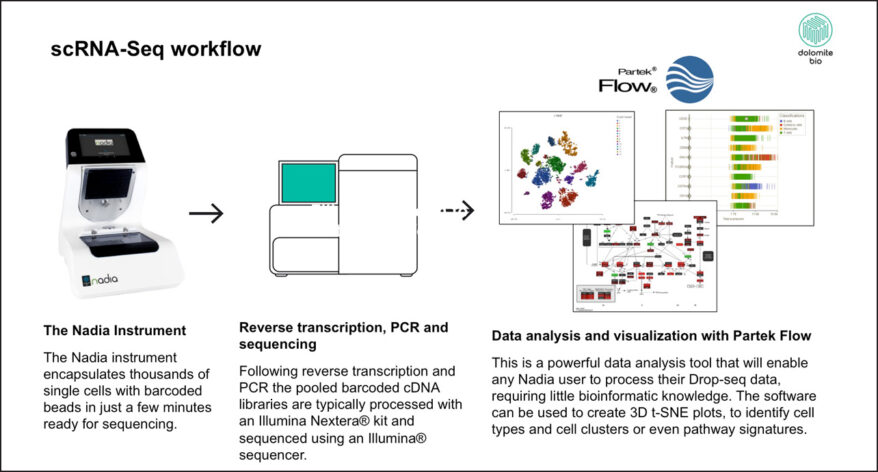
Analyze your single cell data with intuitive point-and-click actions using Partek™ Flow™ bioinformatics software. No command-line experience is needed. It combines the powerful statistics you trust with information-rich, interactive visualizations to take your analysis from start-to-finish. It’s as simple as point, click, and done.
Three-Minute Tour of Our Single Cell Analysis Solution
Single Cell Applications Supported
- Single Cell RNA-Seq
- Single Nucleus RNA-Seq
- CITE-Seq
- ECCITE-Seq (CRISPR compatible)
- TotalSeq
- REAP-Seq
- Feature Barcoding
- Cell Hashing
- Antibody Capture Sequencing
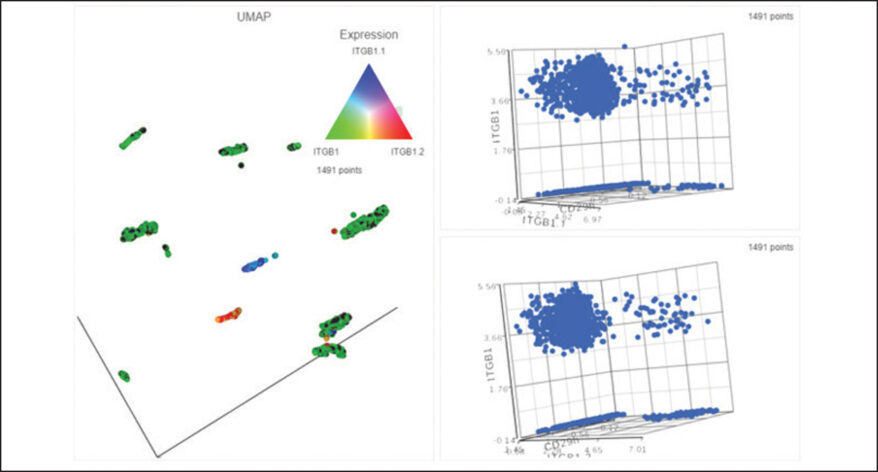
- Flow Cytometry/Mass Cytometry
- V(D)J
- Spatial Transcriptomics
- Single Cell ATAC-Seq with or without scRNA-Seq
Covering the Complete Single Cell Analysis Process
Import data from any major single cell platform and take your analysis from start to finish.

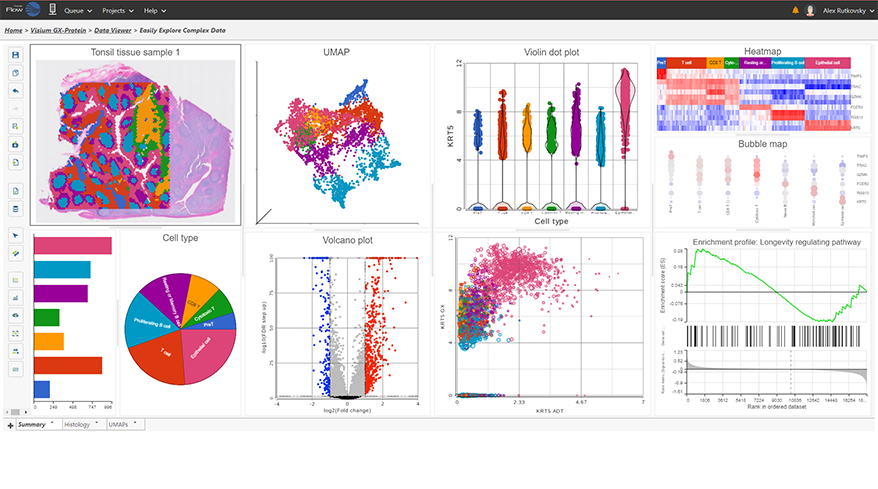
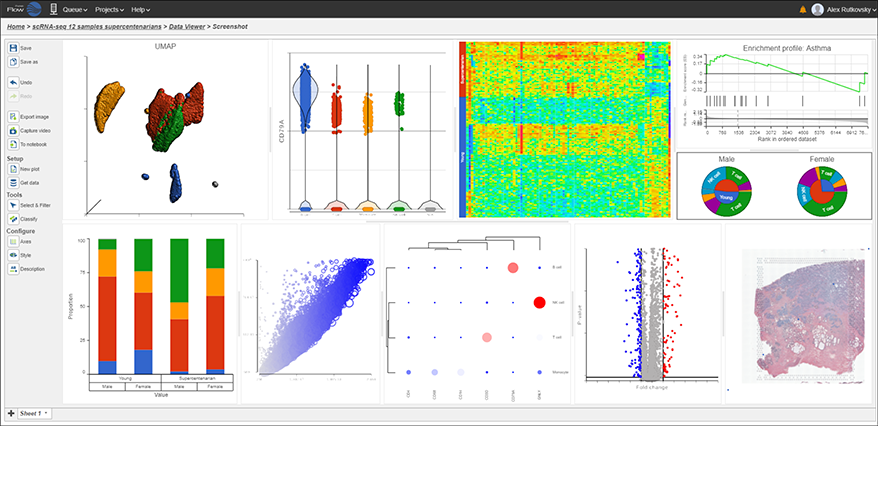
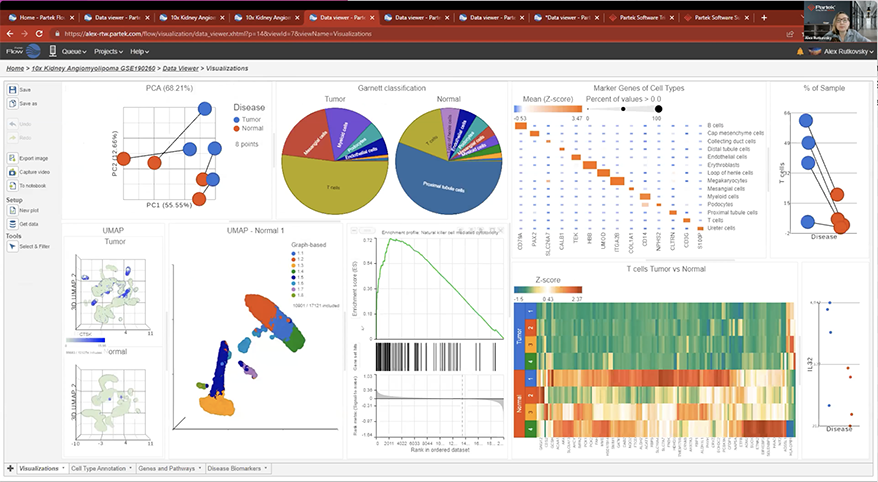
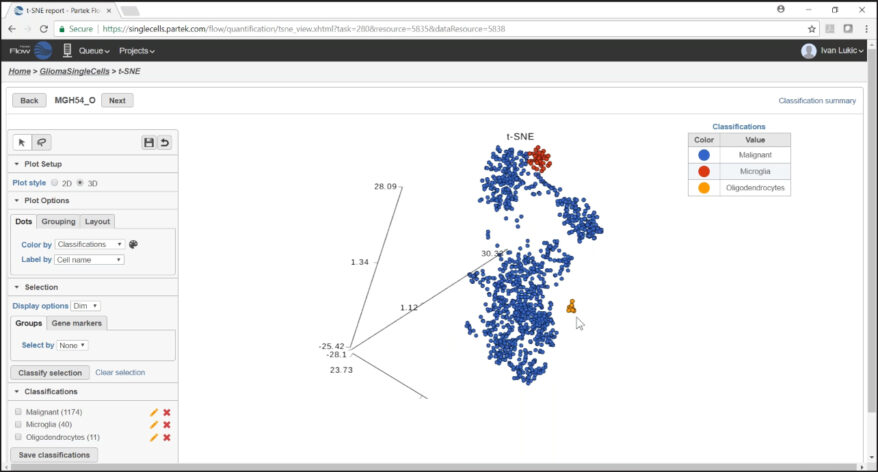
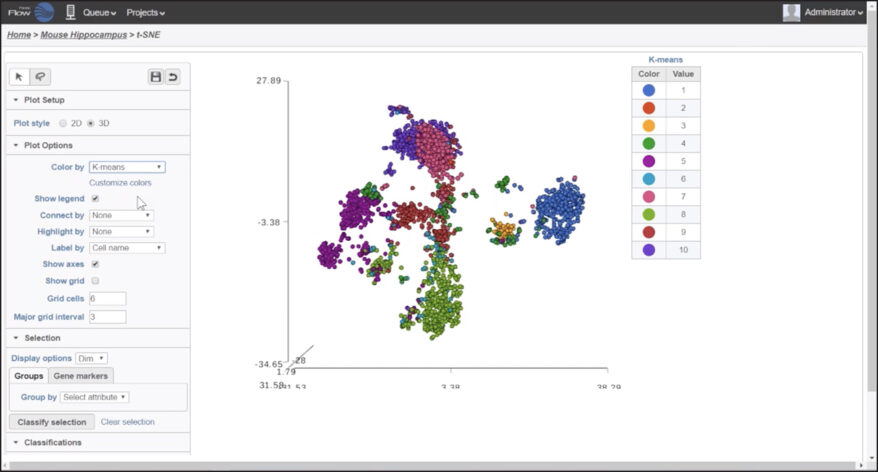
Interactive Visualizations in Partek Flow
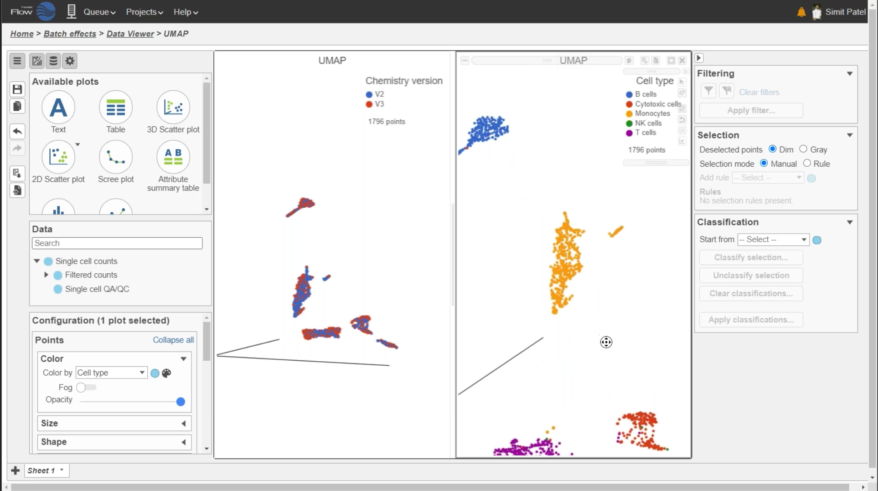
Explore biological insights in your data with fully customizable visualizations and create high quality images for your publications.
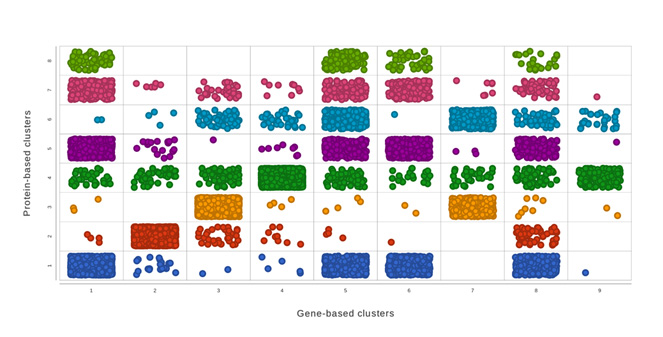
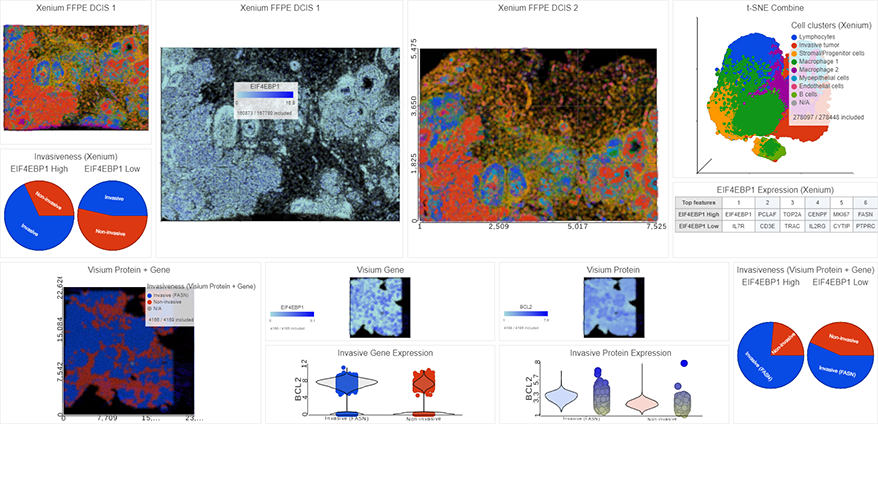
Multiomics Analysis
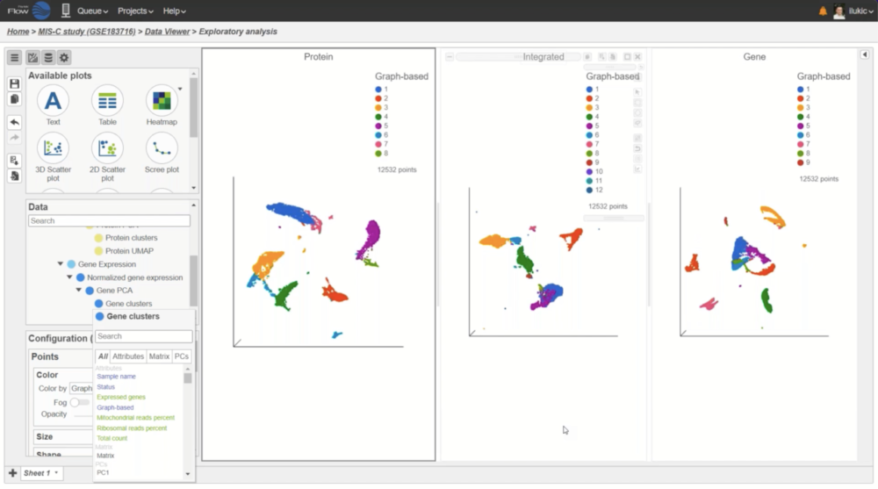
Easily integrate and visualize RNA-Seq and ATAC-Seq, or other assays
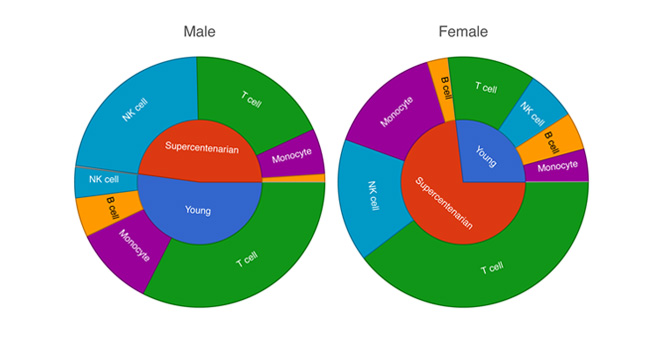
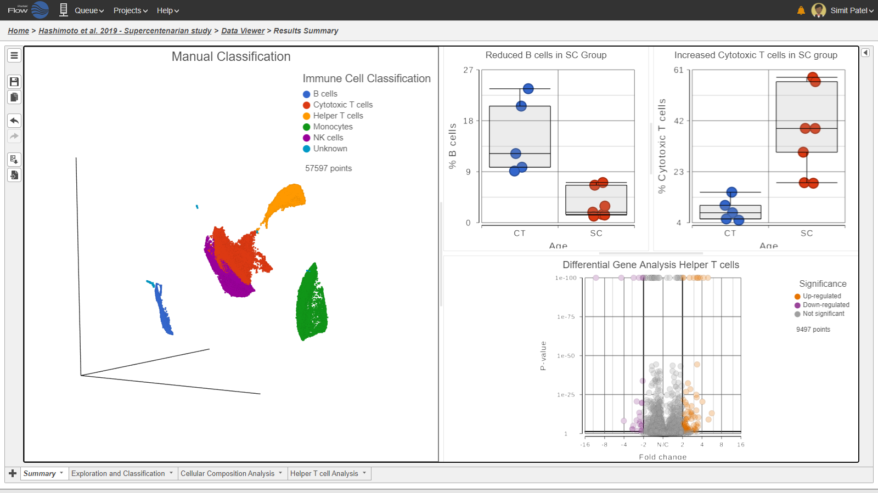
Cell Type Abundance
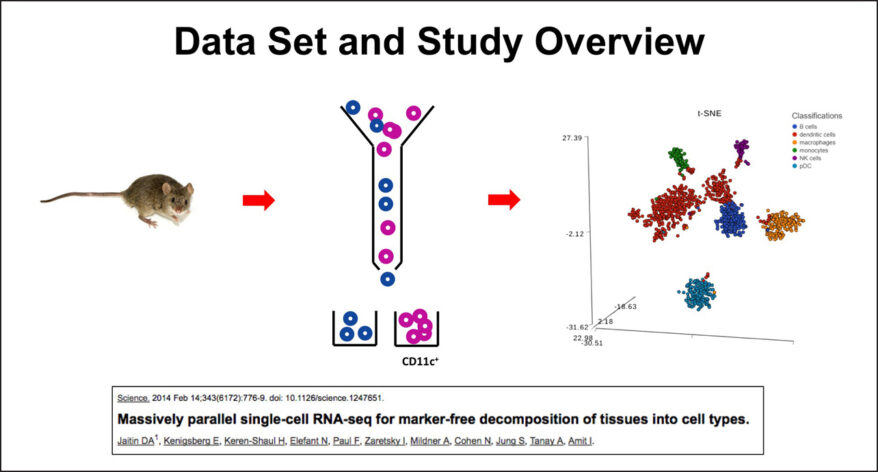
Determine cell type abundance using a variety of plot types
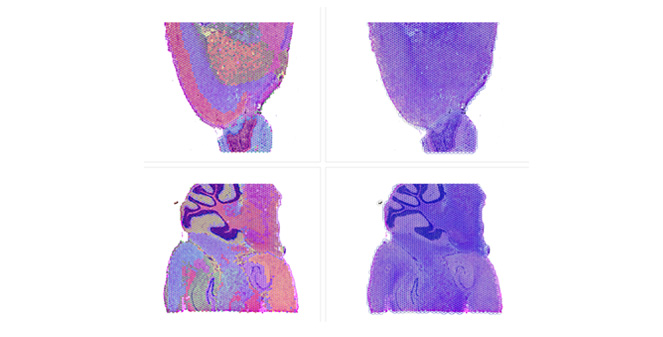
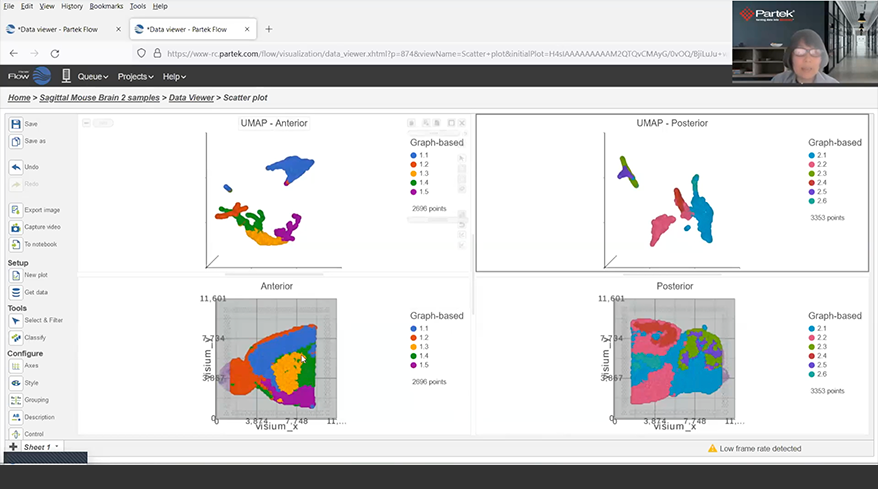
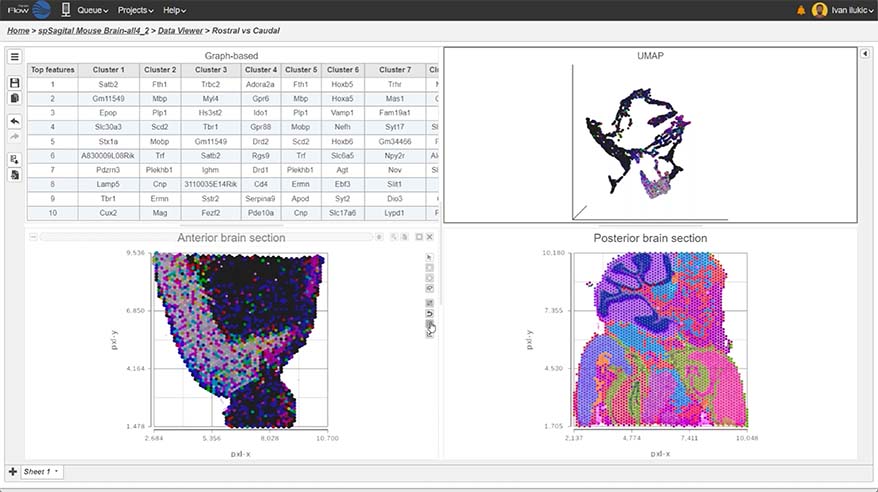
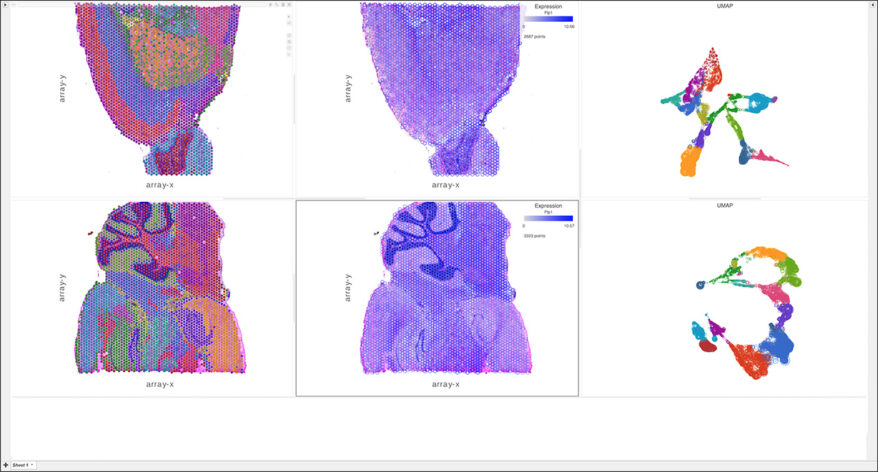
Spatial Transcriptomics
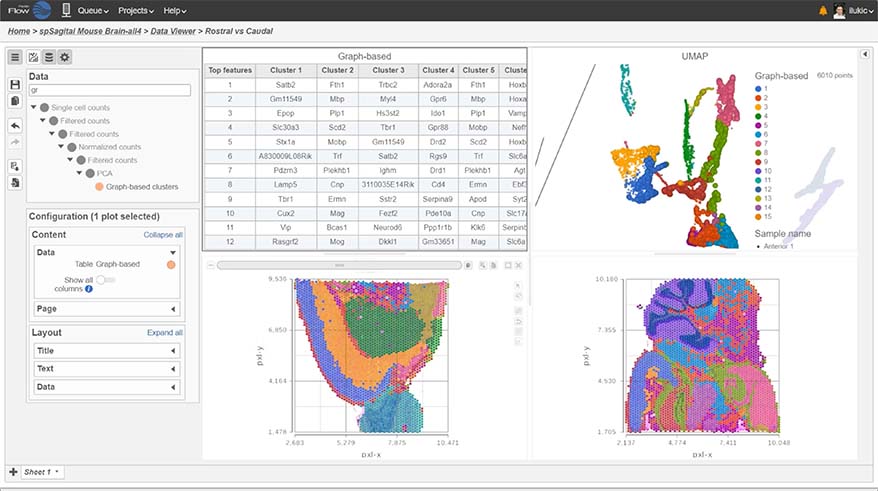
Overlay gene expression data to visualize spatial morphology
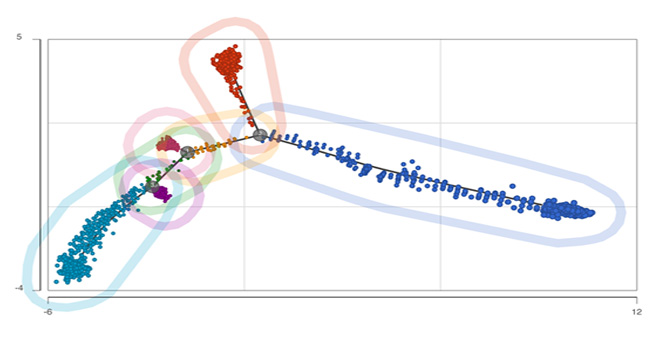
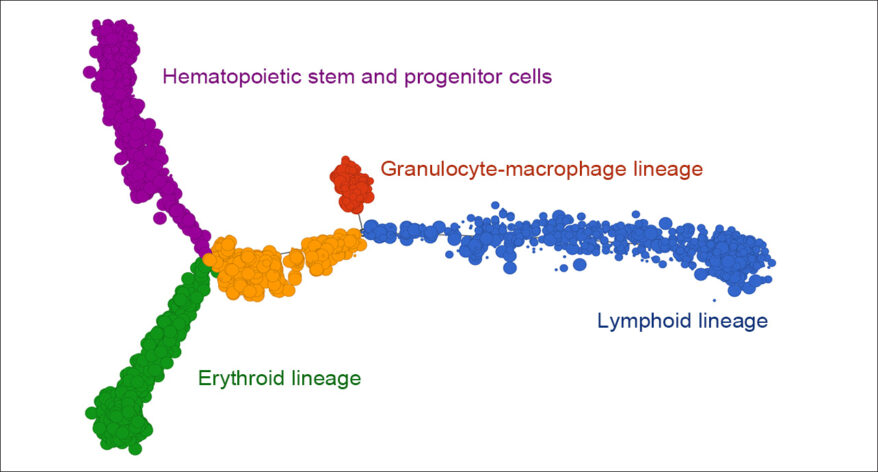
Trajectory Analysis
Analyze biological processes using trajectories
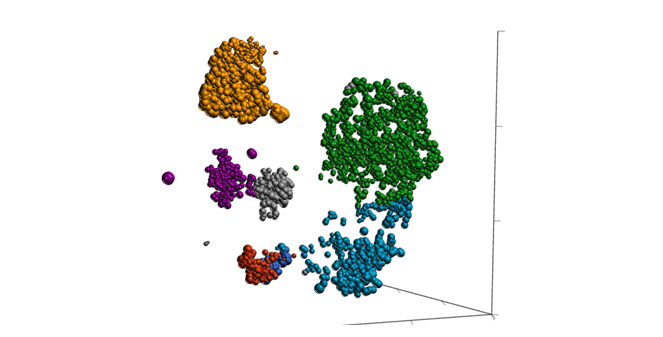
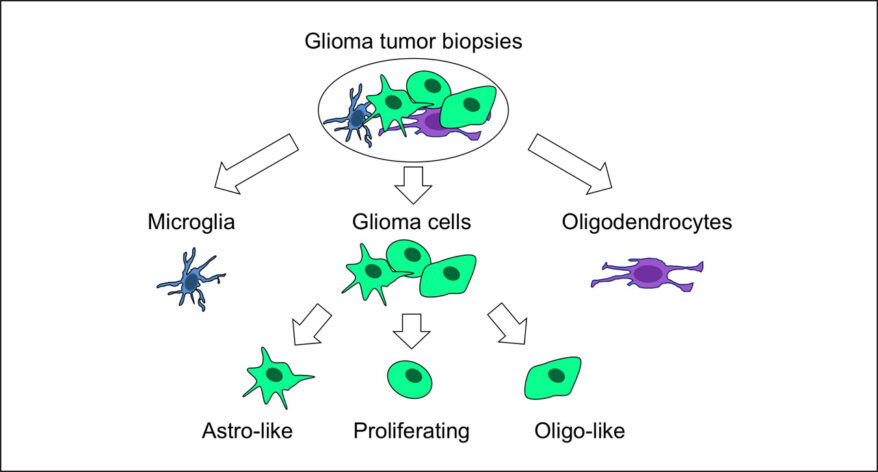
Classification of Cells
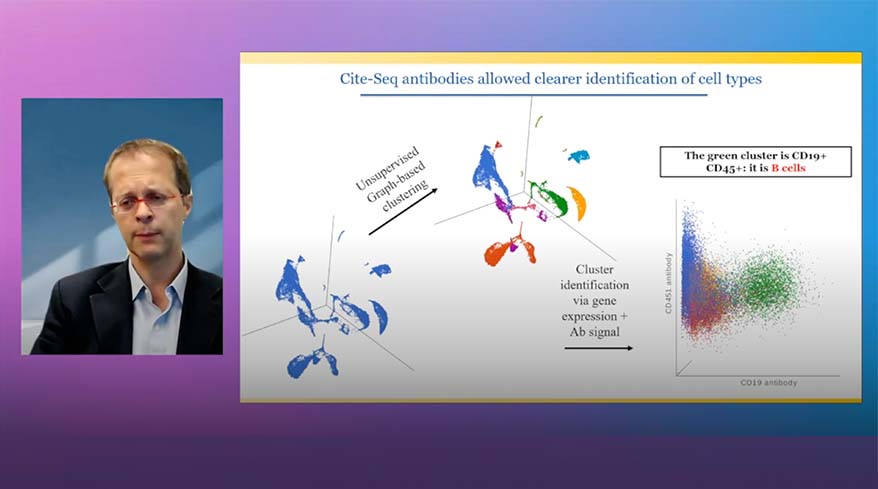
Classify cells by traditional methods or automatically
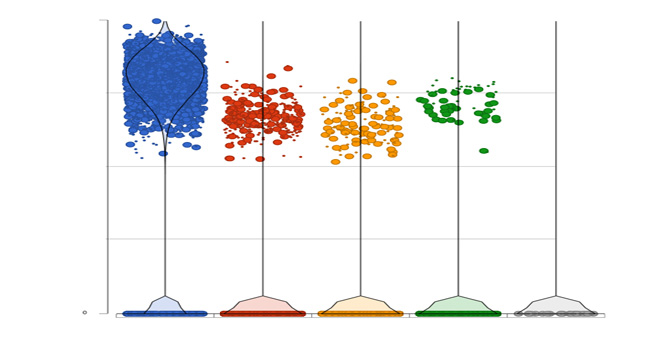
Differential Analysis
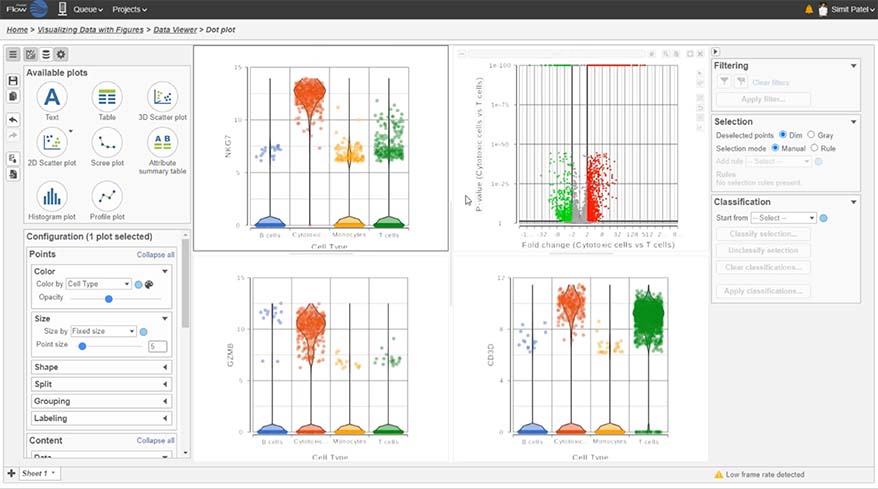
Detect gene expression by type using a dot/violin plot
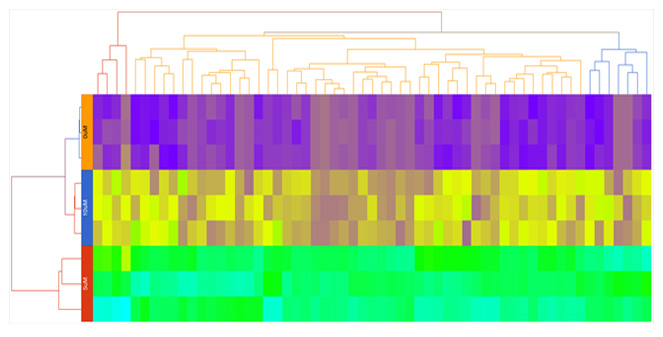
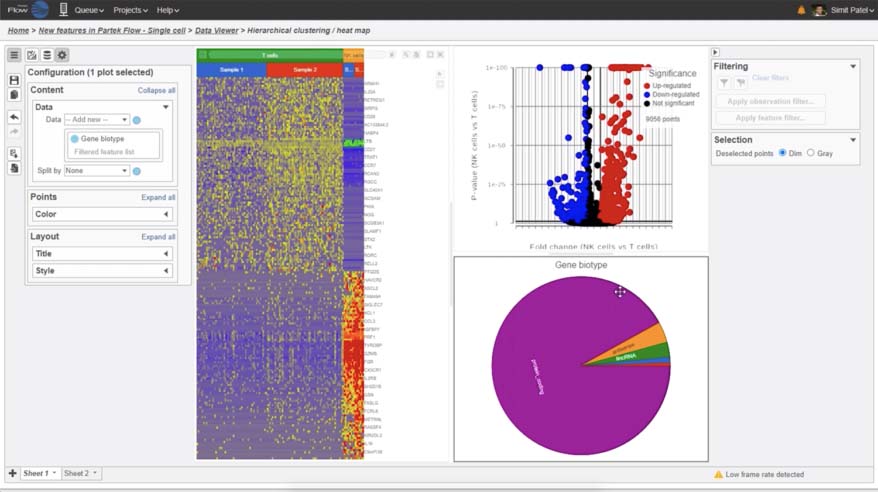
Hierarchical Clustering
Customize heatmaps based on gene lists
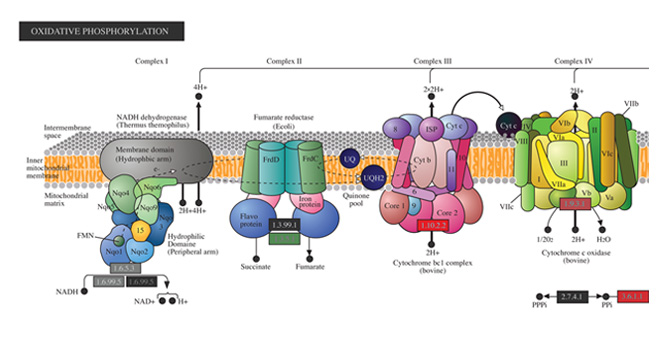
Biological Interpretation
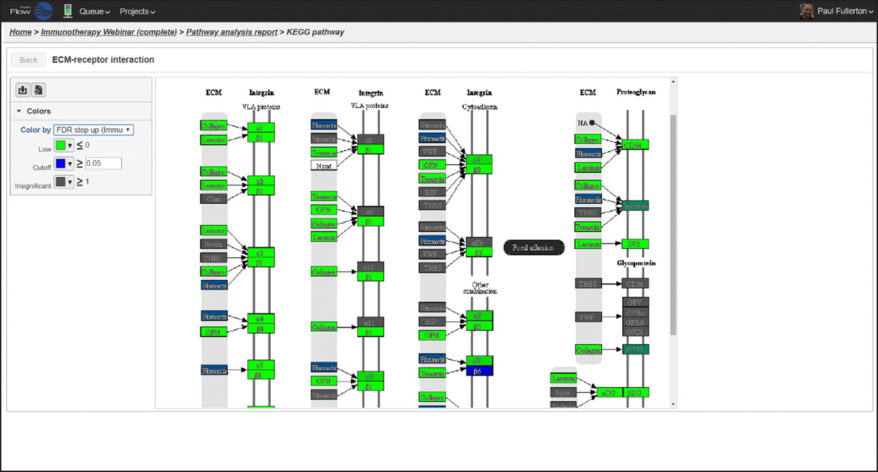
Discover meaningful biological insights using integrated pathways
Frequently Asked Questions
Your analysis can start with fastq/bcl, count matrix, or Seurat objects.
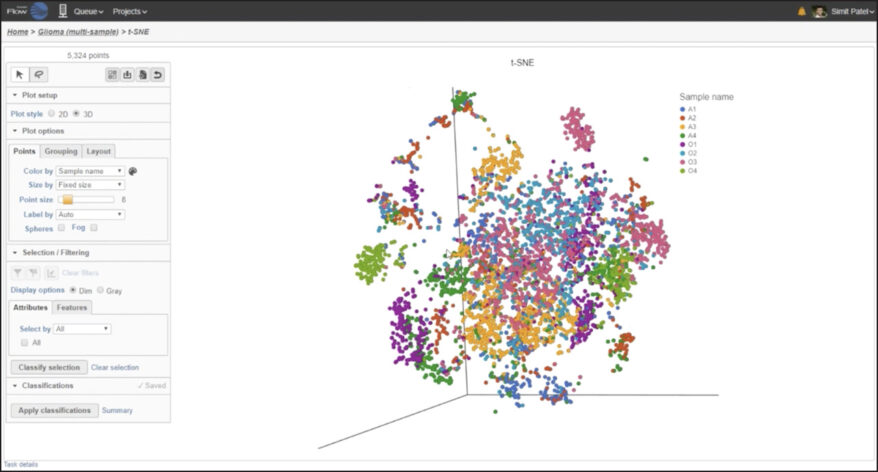
Partek Flow offers many ways to interact with and present your data. Here is a quick summary of some of the available options: PCA, t-SNE, UMAP, volcano plots, heatmaps, bubble maps, Venn diagrams, dot plots, KEGG pathways, Sankey plots, histograms, TSS plots, pie charts, cell trajectory graphs, knee plots, scatter plots (2D or 3D), bar charts, tissue spot histology images, violin plots, and box-whisker plots.
There are multiple ways to classify cells in Partek Flow, including the Garnett algorithm for automatic cell classification.
Yes, you can create and import custom gene lists for analysis. Additionally, Partek Flow provides access to hosted gene lists curated from a variety of popular publications.
Yes, we offer web-based training sessions for first-time users and ongoing analysis assistance. Additionally, we provide access to online documentation and a variety of webinars and training videos.
Export data at any stage of the analysis process including the whole project, visualizations, or pipelines.
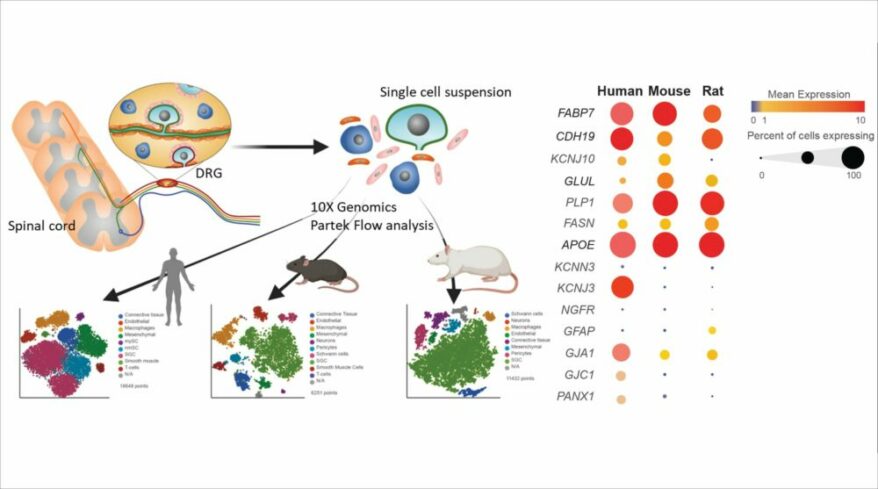
Process Data from Any Single Cell Technology
Powerful Tools & Features in an Easy-to-Use Application:
 |
Automatic or Manual Cell Classification Classify your cells by traditional methods or automatic cell classification using regression-based methods for human and mouse. |
 |
Interactive Visualization Modify data-rich visualizations with direct manipulation to drill down to the details you need and export in publication-ready formats. |
 |
Powerful Industry-Standard Statistics The gold standard statistical methods you need to find differences, similarities, or even factors influencing survival rate. |
 |
Easy Data Import and Export Import any fastq/bcl, count matrix file, or Seurat object and export your analysis at any point in industry-standard formats. |
 |
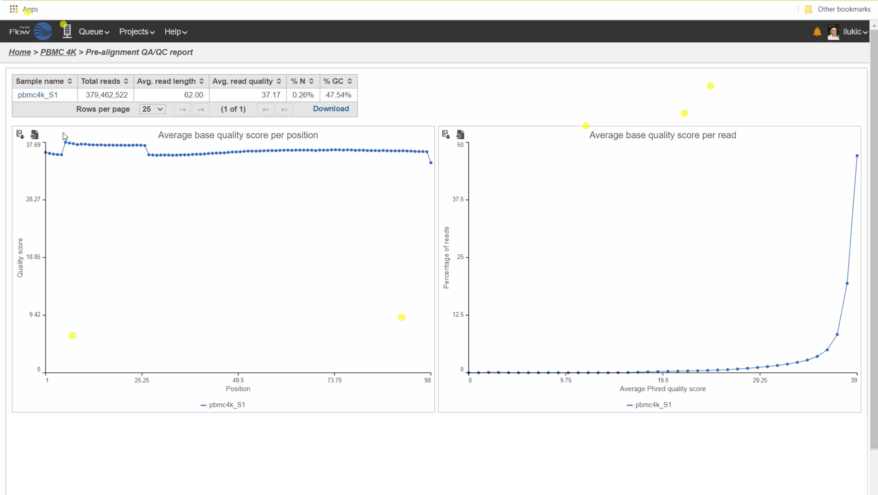
Robust QA/QC Capabilities A variety of quality assurance/control tools and reports are available for unaligned and aligned reads allowing you to evaluate the status of your analysis and optimize downstream viability. |
 |
Multi-Sample Analysis Analyze and visualize multiple samples together or independently and discover biological variations with combined and split-by-sample analysis. |
 |
Flexible Differential Analysis Powerful statistical analysis tools help you determine patterns and markers in datasets, including genes, proteins, and pathways. |
 |
Complete and Unbiased Biological Interpretation Learn more about the biology underlying gene expression changes in your data using gene ontology (GO) or pathway enrichment analysis. |
| Discover Biomarkers that Define a Cell Population Use biomarkers to define a cell population, condition, or another parameter within your study. |
|
| Compare Cell Type Populations Between Experimental Groups Whether it’s rare or common cell types, our extensive statistical models can help make meaningful comparisons. |
 |
Learn about the single cell analysis process, popular assays, and access detailed training material in our Single Cell Resource Guide. |
Select Single Cell Publications
Macrophages activated by hepatitis B virus have distinct metabolic profiles and suppress the virus via IL-1β to downregulate PPARα and FOXO3
Bermea, Kevin C. et al., Frontiers in Immunology (2022)
The human myocardium harbors a population of naive B-cells with a distinctive gene expression signature conserved across species
Li, Yumei et al., Cell Reports (2022)
Mutated clones driving leukemic transformation are already detectable at the single-cell level in CD34-positive cells in the chronic phase of primary myelofibrosis
Parenti, Sandra et al., NPJ Precision Oncology (2021)
Transcriptome-Wide Off-Target Effects of Steric-Blocking Oligonucleotides
Holgersen, Erle M. et al., NPJ Precision Oncology (2021)
A Shift Towards an Immature Myeloid Profile in Peripheral Blood of Critically Ill COVID-19 Patients
Vadillo, Eduardo et al., Archives of Medical Research (2020)
Satellite glial cells promote regenerative growth in sensory neurons
Avraham, Oshri et al., Nature Communications (2020)
Ask a question or request a software demonstration/trial
Single Cell Webinars


